PROCESS EFFICIENVY AND TRANSPARENCY FOR
SALZBURG BUILDING MATERIALS GROUP
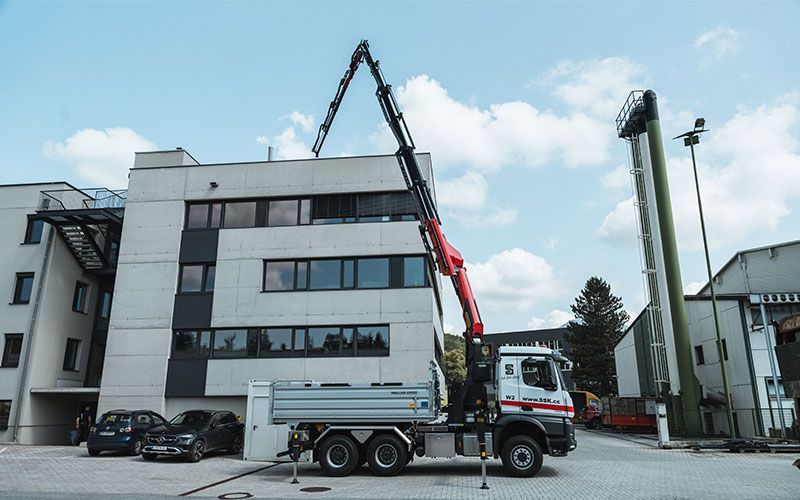
SSK Salzburger Sand- & Kieswerk relies on ppmc.bmi.insights
SSK Salzburger Sand- & Kieswerke GmbH
Industry
Building materials industry
Department
Production, Laboratory, IT, Management, Plant management, Controlling
Region
Austria
„After the presentation, it was immediately clear to us that this solution would not only allow us to exploit optimization potential in the laboratory area, but also in areas such as production control, scheduling and invoicing.“
DI Bernhard Prem, SSK Salzburger Sand- & Kieswerke
How SSK digitizes and analyze their construction material production
Salzburger Sand- & Kieswerke (SSK) is a reliable partner in Salzburg and neighboring Upper Austria and Bavaria for the supply of concrete, sand, gravel, chippings and humus for house building, road construction, agriculture, commercial buildings, power plant and tunnel construction. Around 550 employees work for the company, which was founded in 1971. The success of Sand- & Kieswerke is based on the perfect blend of tradition, sustainability and innovation.
Building materials such as the concrete and gravel waiting to be used by SSK‘s customers must also be perfectly mixed. In order to see more quickly and at a glance whether the ratio of aggregate, cement, water, additives and superplasticizers consistently meets the high quality requirements or whether recipe optimization is necessary, SSK wanted to evaluate the data from various systems using a data analytics solution.
ppmc impresses with Qlikbased analysis tool for the building materials industry
SSK became aware of ppmc ag through industry contacts and was quickly convinced that it had found the right partner with the right digital tool: The global expert for customer-specific business intelligence solutions and digitization consulting has developed ppmc.bmi.insights based on Qlik Sense, a central multilingual analysis tool specifically for the building materials industry that covers all areas relevant to the industry - from order entry and production to quality control, delivery, invoicing and financial accounting. Another decisive factor in the decision was the high flexibility of Qlik Sense, both in terms of application development and the connectivity of various data sources.
“After the presentation, it was immediately clear to us that this solution would not only allow us to exploit optimization potential in the laboratory area, but also in areas such as production control, scheduling and invoicing,” says DI Bernhard Prem, responsible for technology at Salzburger Sand und Kieswerke GmbH.
Go-Live binnen 14 Tagen
Less than 14 days later, Bernhard Prem was able to see for himself that decision-relevant data can be visualized graphically and provide full transparency about the sand and gravel plants at the touch of a button: “ppmc installed Qlik Sense on our server and connected our scheduling program (dorner.optimize). The first modules of the ppmc.bmi.insights solution suite were then installed and we were able to get started with evaluations for the tenant SSK Beton.”
A dashboard displays the number of delivery notes and batches, the quantities produced and the delivery quantities per year, month or day by company, plant and system. Various filters are available: delivery note number, batch number, customer, construction site, vehicle number, recipe and type.
Various worksheets offer the option of evaluating and filtering data at a detailed level.
Delivery notes can be analyzed by time stamp, vehicle, driver, construction site, recipe and type.
Detailed information is available on batches such as customer, construction site, quantity delivered, plant, type, recipe, vehicle, delivery note number, production date and mixers used. A summary report provides details on the raw materials used in the recipe, such as the density of the material, target and actual values, any deviations, water content, moisture value in percent and dry weight in kilograms.
Graphical and tabular representations of target/actual deviations of materials such as aggregates, binders, admixtures and water can be called up.
Delivery notes, batches and quantities can be compared for water/cement ratio, actual or onsistency errors.
Production and delivery quantities can be displayed at plant level and analyzed down to delivery note level.
A concreting log contains information on the recipe used, the type of concrete and the material used, with details of target and actual values and deviations.
Production data is available according to parameters such as delivery quantities and dates, batch information, plant and time distribution.
Customers can be assigned precise information on delivery quantities and types per plant and time period.
The applications are mainly used at management level and by employees from the operating usiness.
Applications for production, laboratory, IT, sustainability and controlling
The application landscape was expanded over the course of the project. Other data sources include two laboratory information systems, a fleet management system, software for fuel billing and a solution for evaluating the vehicles› on-board computers.
A monitoring stream was created to keep an eye on the use of the apps, the number of users and the licenses. Applications are also available for managing the ETL routes.
IT can analyze tickets by quantity, category, average processing time and ticket creator and retrieve detailed information about applications such as name, description, provider and technical and organizational details. In addition, the software programs installed on client devices can be displayed for managing software inventories and checking the installed programs.
In the laboratory area, applications are available for the evaluation of laboratory parameters such as compressive strength, exposure class, consistency class and maximum grain size - filterable by company, plant, type, sampling and tester. A dashboard is also available for internal quantity billing between the subsidiaries and for analyzing material flows from the gravel plant to the concrete plants.
The topic of corporate sustainability is also supported. Among other things, accident statistics and an overview of fuel consumption based on the fuel billing system, navigation devices and on-board computers are available.
An overview of available internal and external training courses and mandatory training requirements for employees is being planned.
We are also currently working on an interface to another laboratory software.
The connection to the ERP system will be used to implement sales analyses, revenue/ margin analyses, customer/article analyses and evaluations of payment behavior, for example. SSK also wants to map comparisons of invoiced quantities with produced quantities as well as analyses by delivery area.
Automated report distrubution with Mail & Deploy
SSK has implemented the Qlik Extension Mail & Deploy in order to be able to send reports to stakeholders on a regular and automated basis. The reporting suite makes it easy to create and distribute reports via various channels such as email, FTP or the Mail & Deploy Hub. “For example, we can use the extension to send weekly concreting reports by email to the site managers at our customers construction sites,” explains Bernhard Prem.
Transparenz und Effizienz
By using Qlik Sense and ppmc.bmi.insights, Salzburger Sand- & Kieswerke benefits above all from significantly improved transparency. The solution makes it possible to quickly and easily retrieve decision- relevant data for various stakeholders such as management and operational employees - for example to optimize recipes or for price negotiations with suppliers.
“Our customers also benefit from this transparency,” explains Bernhard Prem. ”When a customer calls, we can immediately provide information on whether the concrete produced meets the quality requirements and what quantities were delivered from which plant in which period.”
In addition, the automation of processes, such as the automatic reporting of accidents to the HR department or the creation of concreting reports for site managers on the customer side, ensures greater efficiency. Qlik Sense also helps to uncover inconsistencies in the data so that Salzburger Sand- & Kieswerke can continuously improve the quality of its data.
Knowhow-Transfer inclusive
“By working closely with ppmc on the introduction of ppmc.bmi.insights, we were able to expand our Qlik know-how very well. Due to their extensive experience in the building materials industry, ppmc is a valuable sparring partner for us. Their in-depth specialist knowledge and practical expertise help us to make our projects more efficient. Both sides benefit from the joint professional exchange, which leads to the development of innovative solutions. And if I want, they explain to me exactly how what was done and why. Working together like this is really fun.”
And this good collaboration yields benefits for the entire industry.
Revolutionary Global Warming Potential calculation
The construction industry is under increasing pressure to reduce its CO2 emissions and implement more sustainable processes. In light of global climate targets and increasingly stringent regulations, companies are obliged to do their part to minimize their environmental footprint and develop innovative solutions to reduce emissions.
Based on SSK's industry experience and ppmc›s specific analytical expertise, the two companies have jointly developed a Qlik Sense application for calculating and analyzing global warming potential (GWP). “The GWP value indicates how many kilograms of CO2 are released per cubic meter of concrete during production,” explains Bernhard Prem. ”Previous calculation methods, often based on Excel spreadsheets, are time-consuming and error-prone, as recipe data has to be entered manually for each calculation. The new app automates this process and enables a simple GWP calculation directly from the recipe data.”
The app visualizes the various sources of emission along the concrete value chain:
- A1 (Raw material extraction): CO2-emissions from the extraction of raw materials.
- A2 (transportation processes): Emissions from the transportation of raw materials to the concrete plant.
- A3 (Manufacturing process): Emissions from precessing materials in the concrete plant.
- A4 (transportation to the construction site): CO2-emissions during transportation of the finished concrete to the contruction site.
The app shows these values both aggregated and in detail for different plants and materials. A dominance analysis visualizes which process or material has the highest share of total emissions.
A key advantage of the app is its ability to identify optimization potential along the entire concrete production value chain. By analyzing CO2 emissions in detail, users can take targeted measures to improve the environmental footprint.
One example is the choice of material: The app makes it possible to identify which material causes the highest CO2 emissions. On this basis, alternative materials can be evaluated in order to reduce emissions. The app also offers the option of optimizing transport routes. It calculates whether a closer plant can be used to reduce transport emissions and thus improve the overall value of the Global Warming Potential (GWP).
The app also helps customers to keep an eye on their own carbon footprint. This is particularly important in order to secure subsidies or avoid penalties for exceeding emission targets. The transparent presentation of the CO2 values of each delivery enables customers to make informed decisions and achieve their sustainability goals efficiently.
The app not only offers comprehensive analyses and optimization options, but also makes it possible to break down the GWP value to different levels and display it in a targeted manner. For example, the CO2 value can be indicated on each individual delivery bill, differentiated by concrete recipe or type. This allows the CO2 balance of each delivery to be tracked transparently.
In addition, the app can use the Mail & Deploy extension to automatically generate reports and send them to customers on a monthly basis, for example. These reports could clearly show the total emissions of a specific customer, construction site or company.
Another option is to calculate the CO2values not only on the basis of the recipe data (target values), but also on the basis of the quantities actually produced (actual values). This allows a CO2 target/actual comparison to be created, which enables an even more precise analysis of emissions. With the appropriate filters, this data can also be applied specifically to a customer, a construction site or a certain time period. For example, you could evaluate how much CO2 a customer caused in February or which emissions were generated for a specific construction site.
“These functions not only offer transparency and traceability, but also a real competitive advantage in the industry. They make it possible to offer our customers a unique service and at the same time meet the requirements for sustainability and emission reduction,” emphasizes Bernhard Prem.
About ppmc
ppmc has been a recognized expert for customer-specific business intelligence solutions and digitalization consulting since 2007. ppmc provides customers from the Alpine Rhine Valley and the DACH region as well as international companies with comprehensive support ranging from consulting, licensing, installation, development and training to support in the areas of data integration and data analytics. ppmc has over 34 years ofexperience in the development of control and scheduling software as well as in the development of customized key figures, analyses and reports for the building materials industry. With this extensive industry expertise, customers have a competent partner in PPMC who can provide them with technical and advisory support.
About Qlik
Qlik transforms complex data landscapes into actionable insights that contribute to business success. More than 40,000 customers worldwide use our portfolio, which stands for modern, business-ready AI/ML and consistently high data quality. Our strengths are data integration and data governance and we offer comprehensive solutions that work with a wide variety of data sources. Qlik›s intuitive real- time analytics uncover hidden patterns and enable teams to overcome complex challenges and capitalize on new opportunities. Our practical and scalable AI/ML tools lead to better decisions faster. As a strategic partner, we improve our customers› competitiveness with our platform-independent
technology and expertise.